Summary
In the past year, the Mega Millions and Powerball
lottery jackpots have shattered records, rocketing
past half a billion dollars each.
Should you have
bought a ticket? Would any size jackpot make
a ticket an economically rational investment?
Mega Millions
and
Powerball
are a popular multi-state lotteries in the United States
that use what's called a "progressive jackpot."
If no one wins the jackpot in a lottery drawing,
the prize money is carried
forward into the next drawing's prize pool, combined with new
money from the previous drawing's sales.
Most people know that lotteries are losing propositions
under normal conditions, but
progressive jackpots can, in theory, grow without bound.
Since the probability of winning a jackpot remains fixed,
an intriguing possibility emerges:
might it actually become profitable, in
expectation,
to buy a lottery ticket?
Many people have already observed that
a lottery ticket purchased in isolation will
have a positive expected value
if the post-tax jackpot grows larger than the
odds of winning.
However, larger jackpots generate higher ticket sales,
and in the case of a tie the jackpot is split among all winners.
Some
analyses
account for the effect of ties, but none that I've found
have observed that as the jackpot grows,
ticket sales appear to increase super-linearly.
This means there is a point of diminishing return
where the negative expectation due to ties
outweighs the positive expectation due to having a larger jackpot.
Taking this into account,
it is unlikely that buying a lottery ticket is
ever profitable in expectation,
no matter how big the jackpot gets.
Winning If You're the Only Player
Let's start with the simplest case.
Imagine that you are the only person buying a
Mega Millions ticket.
A ticket costs $1, and
the probability of winning the jackpot is
1
in 175,711,536.
Therefore, if the jackpot is expected to yield exactly
$175,711,536, then your $1 ticket has an expected value of
$1 -- it's an even-money proposition, albeit one with very
high variance.
To simplify the calculations, assume for now that the
jackpot is the only prize; we'll consider the relatively
small effect of the smaller prizes in a moment.
I'm also assuming there are no intangible benefits to playing, such
as the thrill you get from watching the draw.
And keep in mind just how low the probability of winning is:
imagine someone has laid down a strip of pennies along the
2,000 miles (3,200 km) of highway
from Los Angeles to Chicago, and put a secret "X" on
just one of them. Take a road trip, stop randomly
on the side of the road, and pick up a single penny.
You are about as likely to find the "X"
as you are to win the Mega Millions jackpot.
But this is no time for such negative thinking!
It might seem at first glance that any time the jackpot
grows beyond $175.7 million, it's economically
rational to buy a ticket. Buying a ticket for March's
$640 million drawing would have been a smart move, right?
Slow down, big dreamer.
Unfortunately, an advertised jackpot of $175.7 million
doesn't actually yield $175.7 million in prize money. There
are two important deductions to take into account:
- Net present value. The advertised jackpot is
what Mega Millions will pay you in 26 yearly installments.
However, the dollar you use to buy your ticket is an
up-front cost today. For
the comparison to be valid, we have to use the net present
value of the jackpot -- that is, the immediate one-time cash
payout option. (Equivalently, we could consider the cost
of the ticket to be $1 invested for 26 years.)
Mega Millions pays cash up-front at 63% of the
advertised jackpot value.
- Taxes. The top marginal federal tax
rate is 35%. Not all states have an
income tax -- my home state of Washington does not, for
example -- but
states that do have an average tax rate of about
6%. Between the two, you keep about 59% of your
winnings, depending on your state.
So the world-record
$640
million jackpot in March of 2012 wasn't actually worth
$640 million after all.
Taking tax and present value into account, it was really
"only" worth $640 x 0.63 x 0.59 = $238 million if you'd
been the only person
playing.
That's still a lot -- and it would make the expected value
of a ticket $1.35. Seems like a smart bet so far!
Let's also consider the
other, non-jackpot prizes. They are paid immediately
(without the 26-year annuity), so we only need to
discount them for taxes, not present value.
Multiplying each prize by the probability of winning
it
yields its contribution to the expected
value of a ticket:
| Prize |
Post-Tax Prize |
Odds of
Winning |
Post-Tax
Expected Value |
| $250,000 |
$147,500. |
1:3,904,701 |
$0.0378 |
| $10,000 |
$5,900. |
1:689,065 |
$0.0086 |
| $150 |
$88.5 |
1:15,313 |
$0.0058 |
| $150 |
$88.5 |
1:13,781 |
$0.0064 |
| $7 |
$4.13 |
1:306 |
$0.0135 |
| $10 |
$5.9 |
1:844 |
$0.007 |
| $3 |
$1.77 |
1:141 |
$0.0126 |
| $2 |
$1.18 |
1:75 |
$0.0157 |
| Total |
|
|
$0.107 |
The non-jackpot prizes add a total of 10.7 cents of
expected value to a ticket, independent of the jackpot
size.
Added to the $1.35 of expected value from the
jackpot,
a ticket for a $640 million jackpot
purchased in isolation
would be worth
an expected $1.46 -- more than its cost of $1!
Were those people
standing
in line for two hours to buy tickets doing so
for good reason?
Wait a second. I keep saying a ticket would be worth
$1.46 when purchased "in isolation," but all those
people in line were buying tickets, too.
What if you're not the only person playing?
The problem of ties
The analysis so far assumes you're the only one buying
a ticket. The problem is that you aren't.
If more than one ticket hits the jackpot, the prize is split
equally among all the winners, reducing its value to each
winner.
 To make the problem concrete, let's look at the
$640 million jackpot in 2012 again.
According to
LottoReport.com,
a site that has recorded the sales figures for every Mega Millions
drawing since 2007,
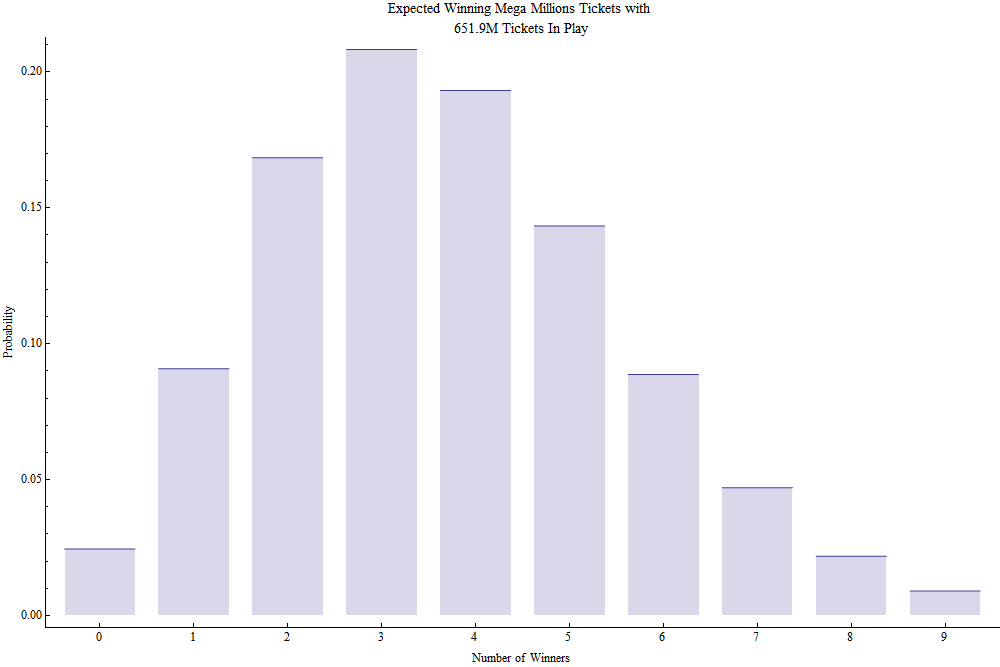
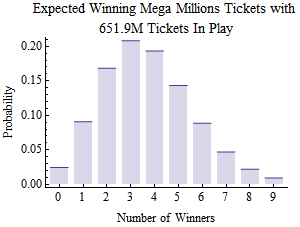
there were nearly 652 million tickets sold to
hopeful future private jet owners.
Let's call this n.
Each ticket was independent and had a 1 in 175.7 million
chance of winning. Let's call this p. The
Poisson
distribution with λ = np = 3.71 tells us
how many winners we could expect in that drawing;
it's shown in the plot on the right
(click to enlarge).
To make the problem concrete, let's look at the
$640 million jackpot in 2012 again.
According to
LottoReport.com,
a site that has recorded the sales figures for every Mega Millions
drawing since 2007,
there were nearly 652 million tickets sold to
hopeful future private jet owners.
Let's call this n.
Each ticket was independent and had a 1 in 175.7 million
chance of winning. Let's call this p. The
Poisson
distribution with λ = np = 3.71 tells us
how many winners we could expect in that drawing;
it's shown in the plot on the right
(click to enlarge).
There was a slim 9% chance that a single winner would
keep the entire jackpot, an 88.5% chance that
there would be a tie among two or more winners,
and a 2.4% chance that the jackpot would remain
unclaimed and grow still larger.
The two most likely outcomes were a three-way tie (20.8%)
and a four-way tie (19.3%). (The actual result: a
three-way tie.)
The overwhelming likelihood of a tie had a devastating effect
on the expected value of a ticket.
The most straightforward way to compute the jackpot's
contribution to each ticket's expected value,
suggested by Mark Eichenlaub,
is to divide the expected total payout by the number of
tickets in play.
The expected payout is just the jackpot size
multiplied by the probability that at least one ticket
would win -- 0.975, in this case. Accounting for those
pesky taxes and net present value, the jackpot only
contributed a paltry 35.6 cents to the value of a ticket in
that drawing!
Using some fancier math,
we can dig a little further into why having so many tickets
in play pushes down the expected value of each one.
Let's assume you'd been holding a winning
ticket. There was only
a 2.4% chance that not a single one of the other
652 million tickets out there won, too. We can repeat
this analysis for every realistic number of winners:
compute the
probability of that kind of tie occurring, calculate the
value of the jackpot per winner in that case, and multiply
those two numbers together to get that scenario's
contribution to the expected jackpot. Add them all up,
and we have the expected value of the jackpot, taking ties
into account, as shown in the table below:
Winners
(Including You) |
Probability |
Jackpot Share
($millions) |
Jackpot Share
Post-Tax NPV |
Contribution to
Expected Jackpot
($millions) |
| 1 |
0.0244739 |
640. |
237.89 |
5.82 |
| 2 |
0.0908017 |
320. |
118.94 |
10.8 |
| 3 |
0.168444 |
213.33 |
79.3 |
13.36 |
| 4 |
0.208317 |
160. |
59.47 |
12.39 |
| 5 |
0.193222 |
128. |
47.58 |
9.19 |
| 6 |
0.143377 |
106.67 |
39.65 |
5.68 |
| 7 |
0.0886581 |
91.43 |
33.98 |
3.01 |
| 8 |
0.0469907 |
80. |
29.74 |
1.4 |
| 9 |
0.0217928 |
71.11 |
26.43 |
0.58 |
| 10 |
0.00898383 |
64. |
23.79 |
0.21 |
| 11 |
0.00333314 |
58.18 |
21.63 |
0.07 |
| 12 |
0.00112422 |
53.33 |
19.82 |
0.02 |
| Total |
|
|
|
62.55 |
With
652 million tickets in play,
a 1 in 175.7 million chance of each ticket winning,
a 63% net-present value,
a 41% tax burden,
and an equal split among multiple winners,
the expected value of a $640 million jackpot to a winner
is just $62.55 million, making
the jackpot's contribution to the
expected value of a ticket only 35.6 cents.
Adding back the 10.7 cents of expected value from the non-jackpot prizes,
the total expected value of a ticket in that drawing
drawing
was just
46.3 cents!
This is far worse than the $1.46 we computed
when we ignored the possibility of a tie.
The expected value of a ticket was actually far below its $1
cost. It wasn't such a smart buy after all.
Ticket sales as a function of jackpot size
Unfortunately, we are still not done dumping cold water on
the dreams of lottery winners. (It's a cruel hobby, I
know.) The analysis above took ties into account, but
assumed a fixed number of tickets in play -- 652 million,
to be exact. However, as the media delights in
reporting,
large jackpots incite a
ticket
buying
frenzy, and that makes ties increasingly likely.
Might the increased possibility of a tie
actually make larger jackpots less valuable to the winners?
 The first step in answering that question
is to model how the size of the jackpot
will end up affecting the number of tickets that are
bought to try to win it.
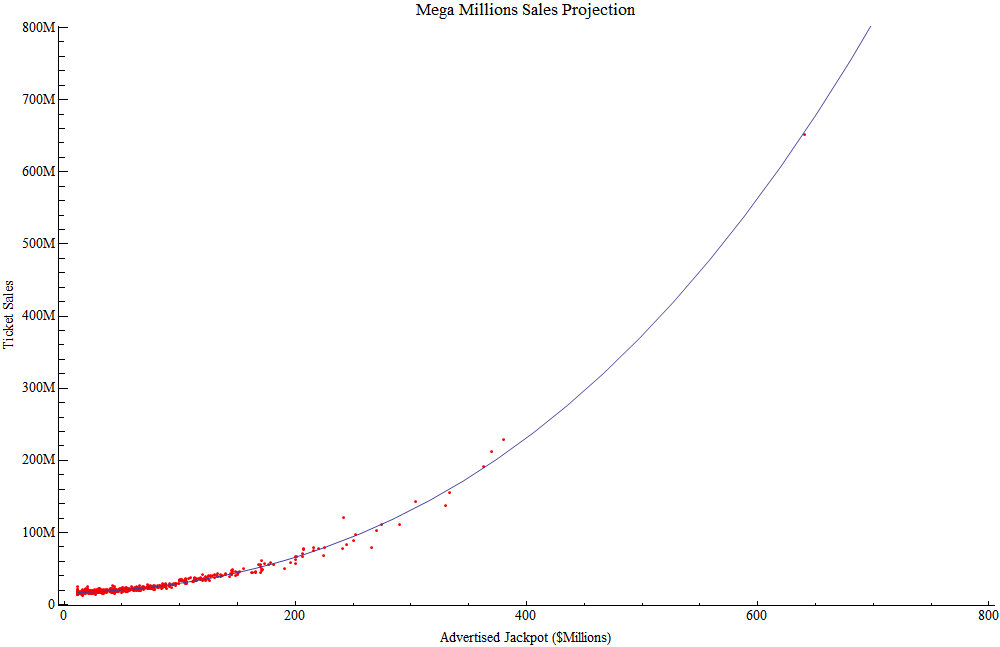
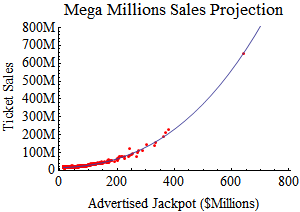
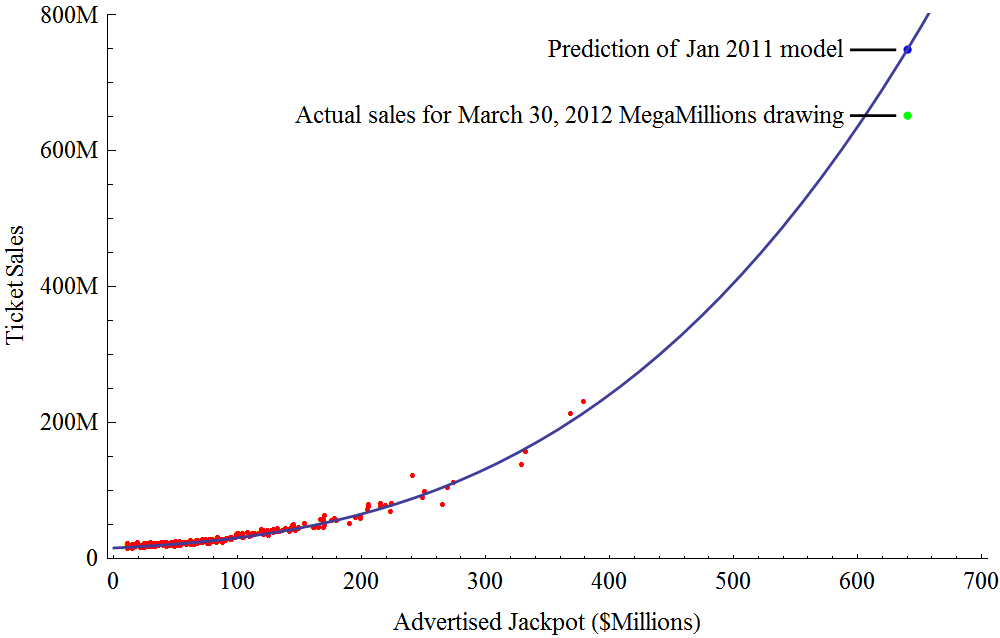
Let's return to the excellent data curated by
LottoReport.com.
The red points in the graph on the right
(click to enlarge) are ticket sales
for 618 MegaMillions drawings since 2007, plotted against
the drawing's advertised jackpot.
The lonely point way out at the top right is
the record-breaking March 2012 jackpot of $640 million,
selling 652 million tickets.
The blue line is the best-fit third degree polynomial.
The first step in answering that question
is to model how the size of the jackpot
will end up affecting the number of tickets that are
bought to try to win it.
Let's return to the excellent data curated by
LottoReport.com.
The red points in the graph on the right
(click to enlarge) are ticket sales
for 618 MegaMillions drawings since 2007, plotted against
the drawing's advertised jackpot.
The lonely point way out at the top right is
the record-breaking March 2012 jackpot of $640 million,
selling 652 million tickets.
The blue line is the best-fit third degree polynomial.
As you can see, with jackpots over about $250 million,
ticket sales really start to take off.
However, it's also important to acknowledge that the data
for jackpots above $350 million is sparse, and
non-existent above $640 million.
The curve may not be predictive for unprecedented
jackpots.
If we ever see a
mind-boggling billion-dollar jackpot,
for example,
it predicts frenzied buyers will pay for
a staggering two billion
tickets.
But there's no way to know with certainty what
would actually
happen if a MegaMillions
jackpot grew to such proportions.
Mass hysteria?
The projected sales curve above also paints a grim picture for anyone still
holding out hope that a lottery ticket can ever be an
economically rational investment.
As the jackpot grows in
value,
the number of people who try to win it grows
super-linearly.
This human behavior has a mathematical consequence:
even though the
jackpot itself can theoretically grow without bound, there is
a point at which the consequent ticket-buying
grows to such a fever pitch that the expected value of the jackpot
actually starts going down again.
The graph below shows the effect, plotting
advertised jackpot size against expected jackpot value
if you win. It takes everything into account we've
discussed so far: net present value (63% of jackpot), taxes
(41% off), and the increasingly
devastating effect of ties as the number
of tickets grows super-linearly with jackpot size.
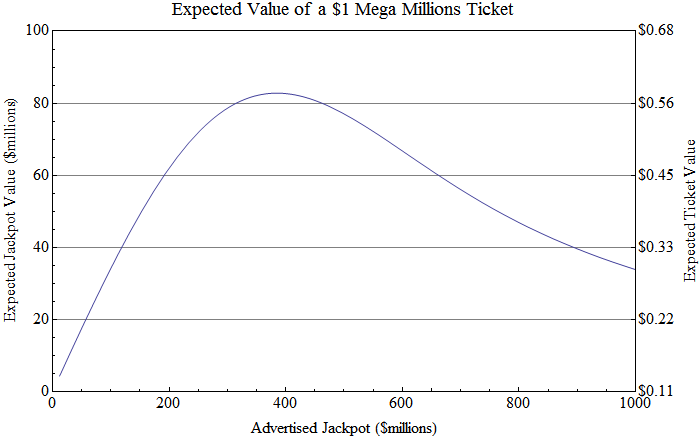
The right-hand axis in the above plot shows the expected
value of a ticket at each advertised jackpot size; it is
the expected jackpot value times the 1/175.7 million
probability of winning the jackpot,
plus the 10.7 cents of expected
value
that comes from the non-jackpot prizes.
It peaks at
57.8 cents
when the advertised jackpot reaches $385 million.
The $640 million jackpot in March was already on the
downward part of the curve;
a ticket for that drawing was actually
worth less, in expectation, than a ticket for the
$363 million jackpot that preceded it!
As long as the superlinear ticket growth holds up,
tickets for even bigger jackpots will be worth even less.
In no case does
the expected value of a ticket ever exceed the break-even point of $1.
Thus, Mega
Millions tickets are never an economically rational investment, no
matter how big the jackpot grows.
Powerball
Powerball
is similar to Mega Millions: a multi-state lottery
with a progressive
jackpot that is split equally among winning tickets.
For most of its history, tickets cost $1.
However,
they've made various rules changes since 2012, including
raising
the price of a ticket to $2
and making tickets more likely to win small prizes and
less likely to win the jackpot.
(The Powerball jackpot odds
are now
one in 292 million, much lower than its
former value, nearly identical to MegaMillions, of 1 in 175 million.)
This was clever: selling half as many tickets at twice the
price might seem to be revenue-neutral, but fewer tickets
and lower odds of hitting the jackpot means fewer jackpot
winners.
Fewer jackpot winners makes
larger jackpots more likely, and large jackpots produce
huge spikes in ticket sales.
This effect is important to our analysis because fewer tickets
in play also means fewer ties and more money, in
expectation, for a winner.
Might Powerball
hold the key to financial salvation?
Unfortunately for those of you hoping to buy a sports team,
Powerball turns out to be a bad bet, too.
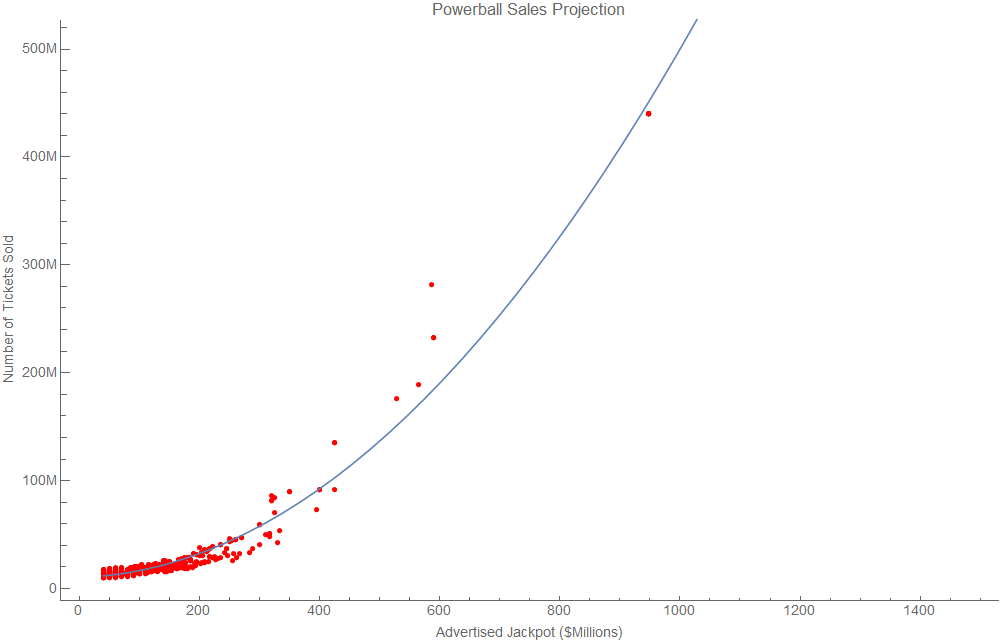
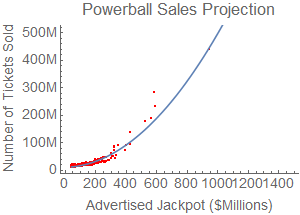
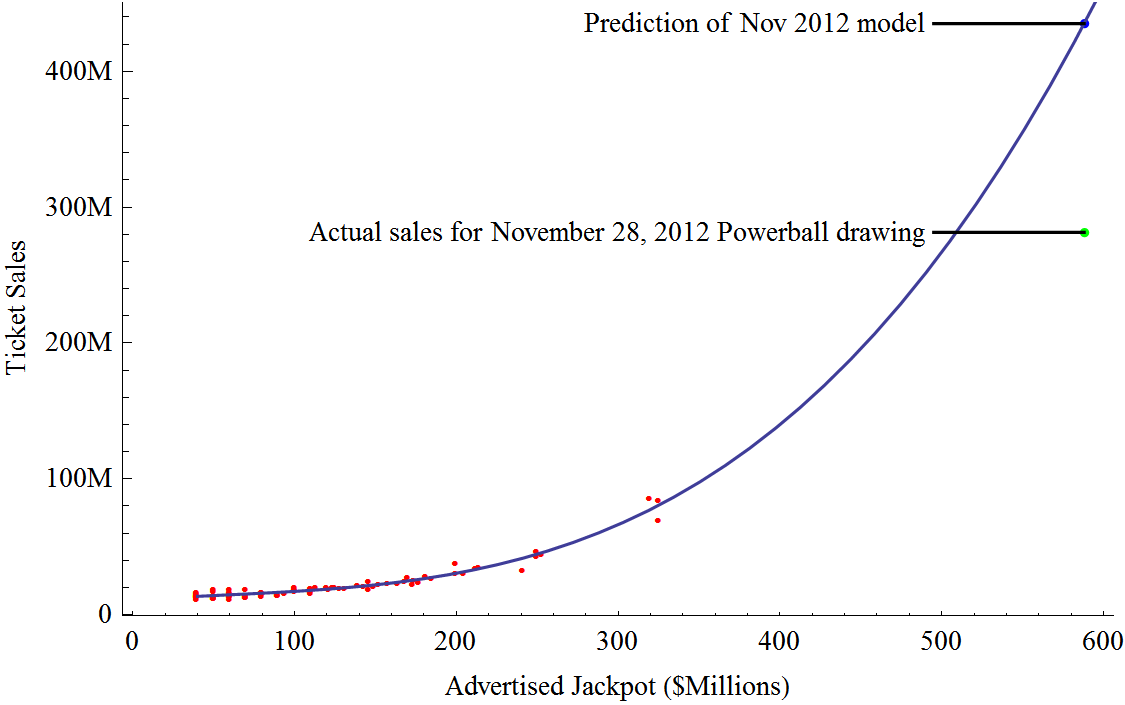
As with Mega Millions, Powerball's ticket sales
(again, from
LottoReport) are
superlinear, shown in the graph on the right
(click to
enlarge).
Included are sales data between the ticket price increase
(January 2012)
and now (January 2016).
The point way out on the top right is the record-breaking
$948 million jackpot on January 9, 2016, that sold
440 million tickets. That point has been given additional
weight in the curve to help better project the behavior with
large jackpots.
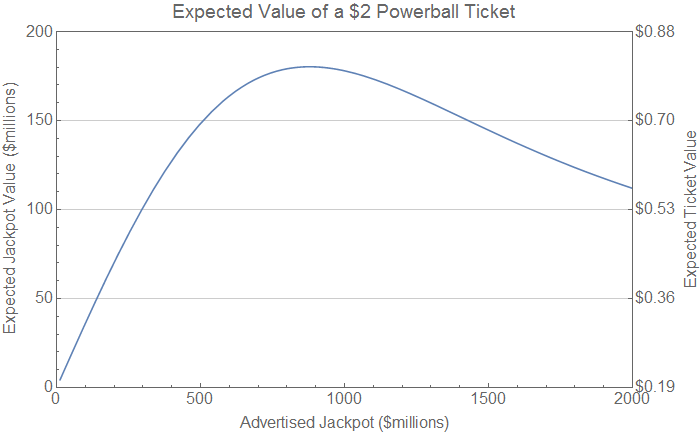
Due largely to the $2 tickets producing fewer ticket
sales,
the effect of ties is delayed compared to Mega Millions.
For Powerball, the best ticket value is for jackpots
advertised at about $890 million. We'd expect to
see about 390 million tickets in play, for which
there'd be a 26% chance of no winner,
a 35% chance of a single winner,
and a 39% chance of a tie among two or more winners.
The expected
value of the jackpot to a winner, accounting for ties,
and discounting for taxes and net present value, would
be
$180 million.
Adding in
the expected
value of non-jackpot prizes of
19.1 cents, this gives the ticket an overall expected
value of 80.8 cents -- less than half of its $2
cost. A good deal for state governments'
ailing tax coffers, perhaps,
but certainly not one for players.
Can the models really predict the future?
It's easy to predict how many tickets will be sold for
a drawing when the jackpot is less than a few hundred million
dollars. We have plenty of data for those drawings
showing consistent sales, so interpolation works well.
But how confident can we be in the model when it
extrapolates to jackpots larger than our past experience?
We've had two opportunities to evaluate the sales model's
extrapolation performance
since I first wrote this article in
January of 2011.
At the time, the record for the largest
MegaMillions
jackpot was $380 million.
The following year, in March of 2012, the jackpot grew to
an unprecedented
$640
million.
Ticket sales skyrocketed due in part to intense media coverage,
some of which even described my analysis of why tickets
were still expected to be unprofitable:
The Wall Street Journal's
blog
and
print
editions,
the Washington Post,
the Atlantic,
and Time
Magazine.
The 2011 model predicted
a Mega Millions jackpot that size would produce
$748m in ticket sales. According
to LottoReport,
actual
sales were $652m, an error of only about 15%.
Based on the drawing's actual ticket sales,
the expected value of a ticket was 46 cents;
the model predicted 42 cents. (10.7 cents of EV came
from non-jackpot prizes in both cases.)
Another test came in November of 2012 when the Powerball
jackpot grew to a record
$587
million. I had never studied Powerball before, but
quickly put together an analysis after NBC's Today
Show asked me to comment in the segment
they aired the morning of the big drawing.
Powerball had changed their rules less than a year
earlier, raising the ticket price to $2 from $1 and
adjusting the prizes to match. This seemed likely to impact
sales, so I only used data from after the
rule change in my model. Unfortunately, this left me
with only 90 data points, and this model did not perform
as well as the MegaMillions model.
281 million $2 tickets were sold to win the
big jackpot, but the model predicted 54% more: 435
million. I'd predicted a ticket's expected
value for that big drawing
would be 67.3 cents; in reality, it was 83.3 cents --
still well short of its $2 price.
The models weren't perfect, but I think their
fundamentals are sound, and they're much
improved from 2011 now that we have new data points
for huge jackpots.
But, perhaps more importantly, these two tests
demonstrated the most important feature of my analysis.
Before the big 2012 jackpots,
every lottery we'd seen had followed the rule
that a bigger jackpot made for a more valuable ticket.
The idea that superlinear sales would force the value
of a ticket back down again was speculation based
on my model of sales trends.
But we've now seen two jackpots above half a billion
dollars, and my prediction came true:
sales were so strong that the negative effect of ties
overwhelmed the positive effect of having a larger
prize. These two drawings are the first
that are past the peaks seen on the
jackpot-vs.-value graphs --
proving that the peaks exist.
Still, it bears repeating that this analysis rests
on our ability to predict future lottery
sales based on the history of previous sales.
Past $640 million, we have no evidence.
Who knows what will really happen
when a billion-dollar jackpot finally happens?
Maybe with a big enough prize,
the market will saturate --
everyone who knows how to
buy lottery tickets has bought
all the tickets they can afford
and the sales curve gets flat.
For the last word on this topic, however, I
cede the floor to
Durango Bill,
who
aptly observes
that driving to the store to buy a Mega Millions ticket
is more likely to be fatal than it is to make you rich.
That's why I plan to walk.
 Jeremy Elson is a computer
science researcher who spends his time outside of work
riding bicycles, flying airplanes, building
electronics, and playing with Mathematica. (This work is a
personal project; I do not speak for my employer.)
Jeremy Elson is a computer
science researcher who spends his time outside of work
riding bicycles, flying airplanes, building
electronics, and playing with Mathematica. (This work is a
personal project; I do not speak for my employer.)